
A histogram is a simple graph that quietly appears on camera screens, editing software, and even phone camera apps. It shows how light or dark your photo or video really is, beyond what your display might suggest. Understanding this exposure graph helps you avoid dull, muddy images, blown-out skies, and unusable shadows, and gives you more consistent results from capture to final export.
Repair Corrupted Files To Save Your Data
 Security Verified. Over 7,302,189 people have downloaded it.
In this article
What Is a Histogram?
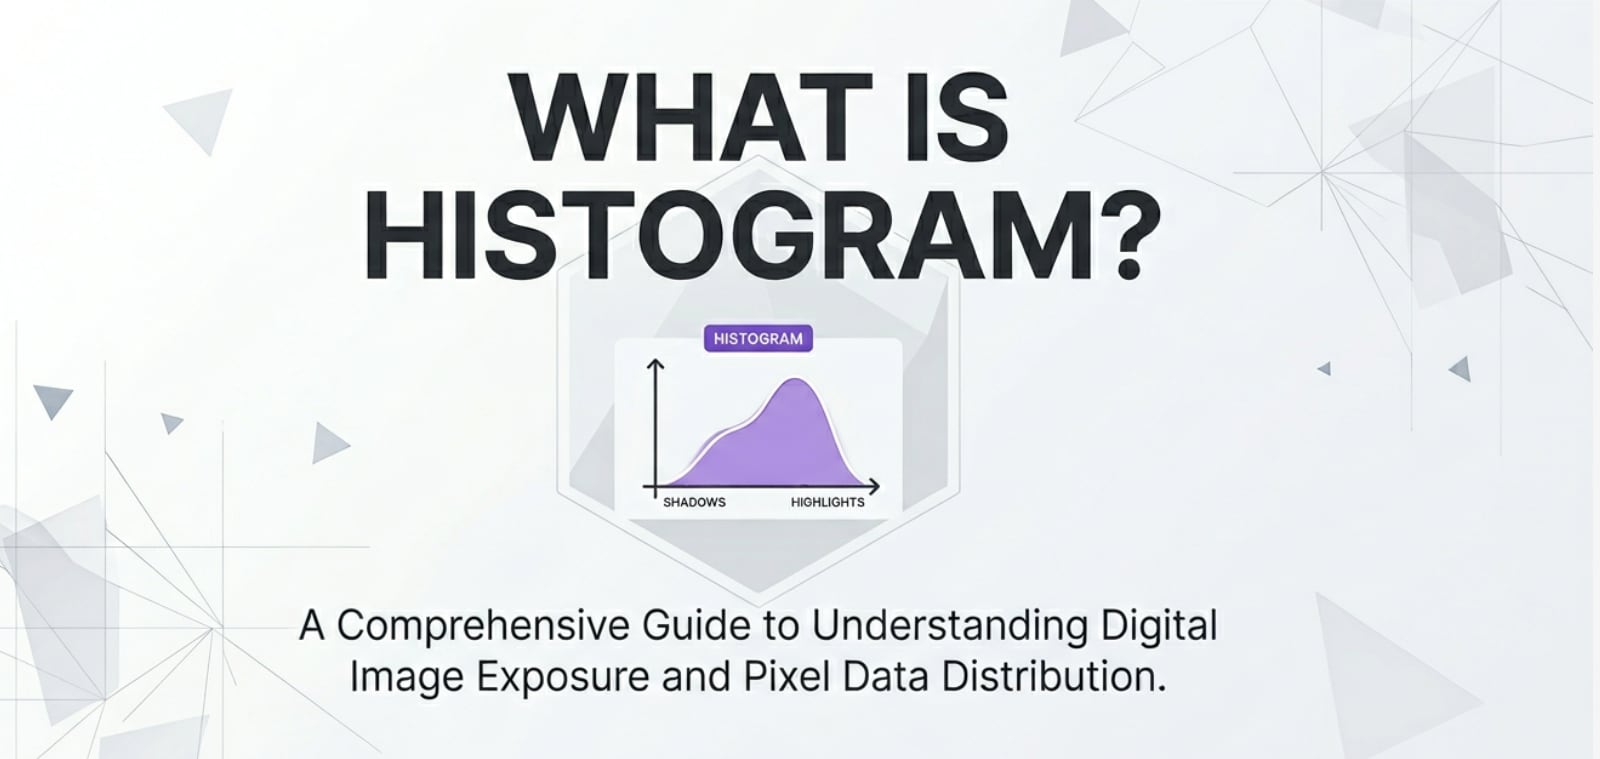
A photo histogram or video histogram is a bar graph that shows the distribution of brightness values in your image or frame. The left side represents dark shadows, the middle shows midtones, and the right side displays bright highlights.
In photography and videography, a camera histogram or editing histogram is an exposure tool. It helps you understand whether your shot is underexposed, overexposed, or well balanced, regardless of how it looks on the camera LCD, monitor, or phone screen.
There are two common types:
- Luma histogram: shows overall brightness (luminance) from black to white.
- Color histogram: shows separate red, green, and blue channels, revealing color balance and channel clipping.
You will encounter histograms when recording, editing, encoding, and exporting images or videos in cameras, NLEs (non-linear editors), and photo editors like Lightroom or Photoshop.
How Does Histogram Affect Your Image or Footage?
The exposure graph you see in a histogram directly reflects how your image will look in terms of brightness, contrast, and detail.
- Brightness and exposure: If the graph is bunched up on the left, your image is likely underexposed. If it piles up on the right, it is probably overexposed.
- Clipped shadows: When the bars are stacked hard against the left edge, you have clipped shadows or crushed blacks. Details in dark areas are lost and cannot be recovered easily in editing.
- Blown highlights: When the graph spikes against the right edge, you have blown highlights. Skies, windows, or bright skin may become pure white, with no texture left.
- Dynamic range: A wide histogram spread shows you are using much of your camera's dynamic range. A narrow hump in the middle usually indicates low contrast or flat lighting.
- Color and channel clipping: A color histogram lets you see if one color channel (red, green, or blue) is clipping before the others, causing odd color shifts or tinted highlights.
- Consistency across shots: Matching histogram shapes between takes helps keep exposure consistent across a sequence, which is crucial for multi-camera shoots and edited timelines.
During encoding, exporting, streaming, and playback, having a well-balanced histogram helps your image stay consistent across different platforms and displays, reducing surprises like crushed blacks on TVs or washed-out highlights on mobile screens.
How Does Histogram Work in Real Shooting?
Where you see histograms in cameras and software
You will find editing histogram tools in many stages of a photo or video workflow:
- On cameras: Most DSLRs, mirrorless cameras, and some smartphones offer a live camera histogram in the viewfinder or rear LCD, plus a histogram in playback mode. For video, some models show a luma or RGB histogram for monitoring exposure in real time.
- On field monitors and recorders: External monitors often display histograms alongside tools like false color and waveform. This is common on professional video shoots.
- In photo editors: Apps such as Lightroom, Capture One, and Photoshop show a histogram in the Develop or Levels/Curves panels while you edit exposure, contrast, or color.
- In NLEs: Video editing software like Premiere Pro, DaVinci Resolve, and Final Cut Pro add histogram scopes for color correction and exposure balancing.
Compared to a waveform vs histogram, the histogram shows only distribution of values, not where in the frame those values appear. Many filmmakers use both scopes together.
Real examples of using histograms on set and in post
Here are some practical ways histograms guide decisions in real shoots:
- Preventing overexposed images: When shooting backlit portraits, you may see the histogram slammed to the right from a bright sky. Dial down exposure compensation or lower ISO until the highlight spike pulls away from the right edge, keeping detail in the sky and skin.
- Protecting shadow detail: In low light, the histogram can be squashed on the left. You might raise ISO, open the aperture, or slow the shutter until the hump moves more toward the middle, avoiding unusable noise and crushed blacks.
- Setting exposure for log or flat profiles: When recording log video, the on-screen image looks washed out, but the histogram lets you judge if midtones and highlights are safe for later color grading.
- Balancing a scene with lights: On a film set, the gaffer may adjust key and fill lights while watching the histogram to keep skin tones in a safe midtone range and avoid blown highlights on the forehead or nose.
- Matching shots in editing: In post, you can align histograms between consecutive clips to quickly match exposure and contrast before doing fine color grading.
Best Uses, Common Mistakes, and Quick Tips
When histograms matter most
- Shooting high-contrast scenes with bright skies and deep shadows.
- Recording in difficult lighting, like concerts or night streets.
- Capturing once-in-a-lifetime events where reshoots are impossible.
- Preparing video for HDR or strict broadcast requirements.
Common mistakes with histograms
- Chasing a "perfect hump": Many believe a histogram should form a smooth bell curve. That is a myth. Different scenes demand different shapes.
- Ignoring creative intent: Low-key and high-key images are meant to lean left or right. Forcing everything to the center often kills mood.
- Focusing only on luma: Watching only a luma histogram can hide channel clipping in a color histogram, causing strange color shifts.
- Relying only on the LCD: Trusting the screen brightness without checking the histogram leads to inconsistent results between locations and devices.
Quick tips for using histograms correctly
- Use the histogram as a safety net, not a rule book. Aim to avoid unintended clipping unless it serves your style.
- Turn on RGB histograms when shooting colorful scenes like sunsets, neon lights, or concerts to avoid channel clipping.
- Bracket exposures or shoot RAW when the histogram shows that you are close to clipping on either side.
- During editing, use the histogram as feedback while adjusting exposure, contrast, and curves for photos and video.
The key takeaway: let the histogram guide you to cleaner, more controlled exposures while still leaving room for creative choices.
How to Use Repairit to Fix a Corrupted Photo File
Repairit introduction
Even if your photo histogram and exposure are perfect, technical problems like card errors, interrupted transfers, or power failures can corrupt your image files. Wondershare Repairit is designed to solve this, offering an easy way to fix damaged, unreadable, or distorted photos without needing deep technical skills. You can learn more and download the tool from the Repairit official website.
Key features of Repairit Photo Repair
- Repairs corrupted or unreadable photo files in a wide range of formats.
- Provides an intuitive preview of repaired images before saving.
- Offers simple, guided repair modes suitable for beginners and professionals.
Step-by-step: Fix corrupted photo files
- Add corrupted photo files
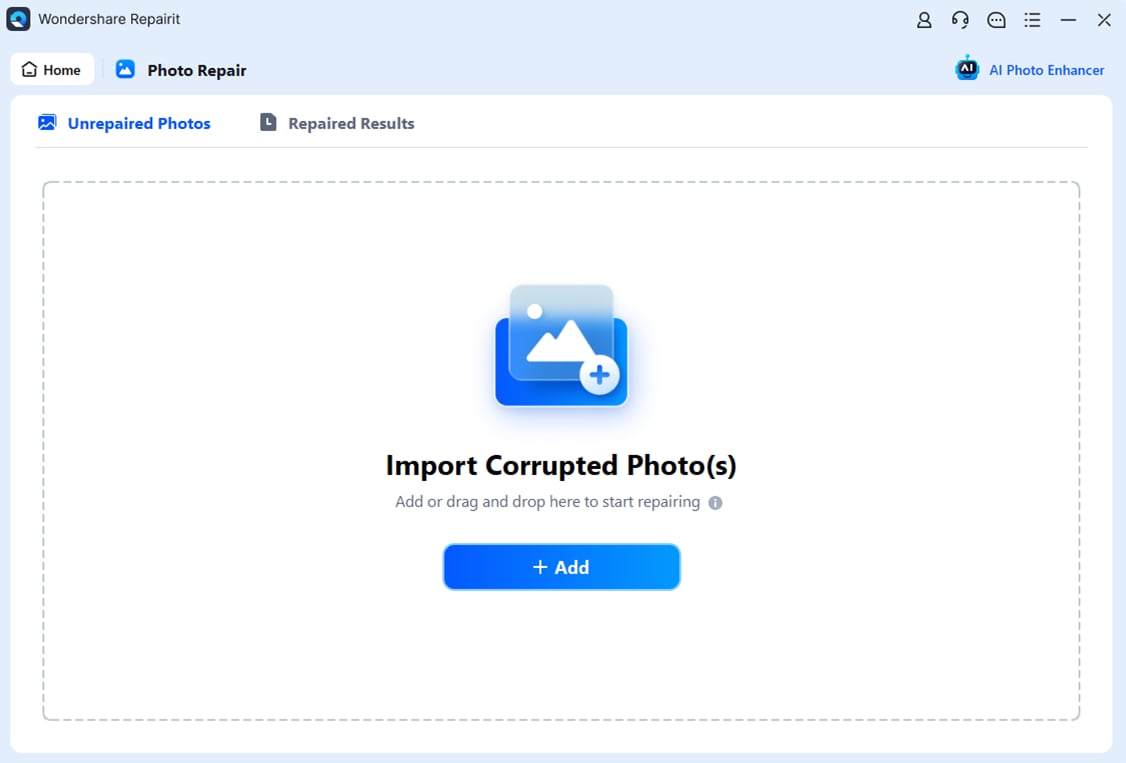
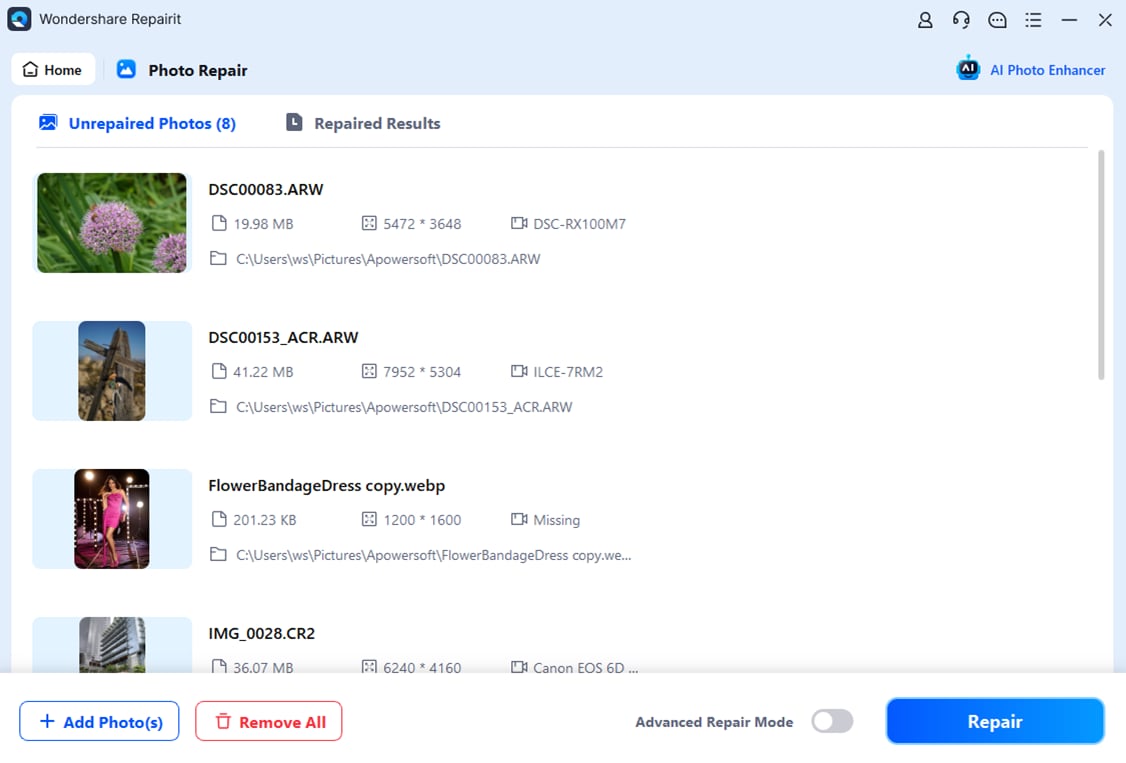
Install and launch Wondershare Repairit, then choose the Photo Repair module on the main screen. Click the add area or the plus icon to open your file browser and locate the folder that holds your broken or unopenable images. Select one or multiple photo files and confirm so they are all listed in the repair panel, along with their basic information.
- Repair photo files
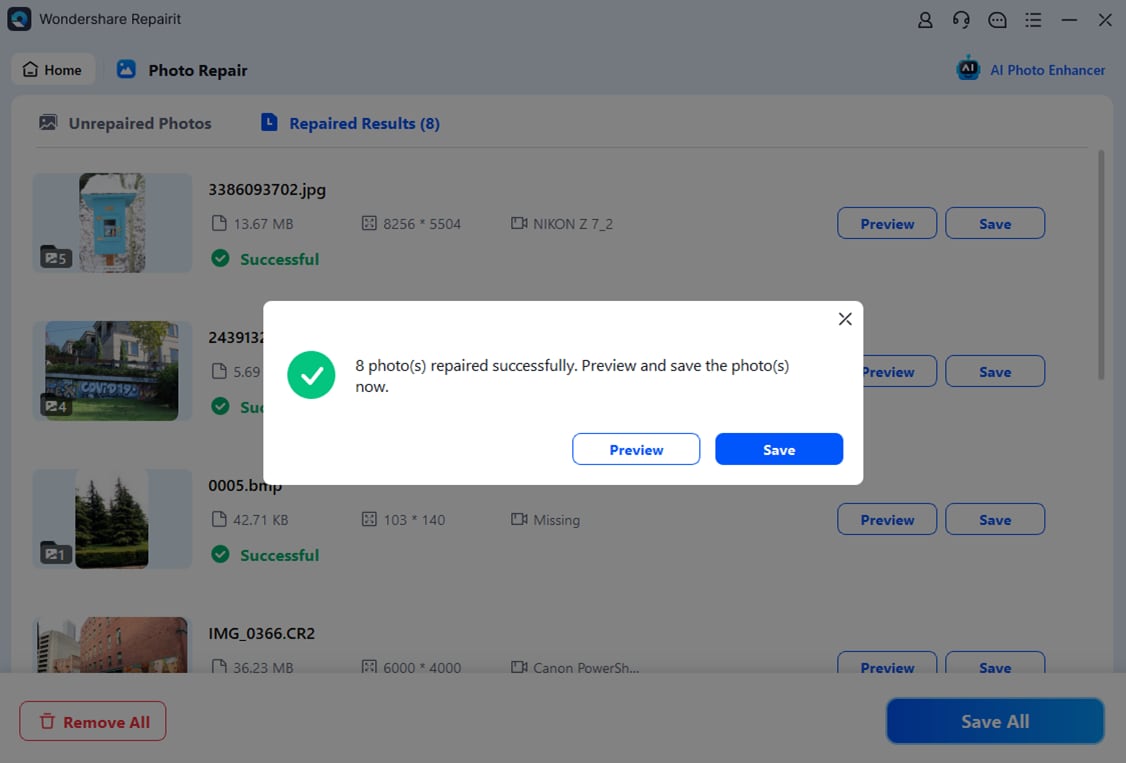
After you have imported the damaged photos, start the repair process with a single click on the Repair button. Repairit analyzes each file structure, reconstructs missing or faulty data where possible, and automatically fixes common issues such as distortion, gray areas, and unreadable headers. When the process finishes, you can preview the repaired images in the interface to confirm the results before saving anything.
- Save the repaired photo files
Once you are satisfied with the previews, tick the photos you want to keep and click Save. Choose a safe destination folder that is different from the original storage location, such as another drive or a backed-up directory. Repairit then writes clean, repaired copies of your images to that folder so you can organize, edit, or share them without corruption issues.
Conclusion
Understanding what a histogram is, and how to read it, gives you an objective way to judge exposure, contrast, and tonal balance in both photos and video. By checking the graph instead of trusting only your screen, you can avoid clipped shadows, blown highlights, and inconsistent brightness between shots.
Use your histogram during capture, editing, and export as a fast quality check that supports your creative decisions instead of limiting them. If technical glitches corrupt your perfectly exposed images, a repair tool like Wondershare Repairit can help you recover damaged photo files and protect the work you put into every frame.
Next: False Color
FAQ
-
1. What is a histogram in photography?
A histogram in photography is a graph that shows how the brightness values in an image are distributed from dark shadows on the left to bright highlights on the right. It helps you quickly evaluate exposure and contrast. -
2. Is a perfect histogram supposed to look like a smooth hump?
No single histogram shape is perfect. The ideal shape depends on the scene. High-key scenes may lean to the right, low-key scenes to the left, and contrasty scenes may spread across the entire range. The key is avoiding unintended clipping unless it serves your creative goal. -
3. What does clipping mean in a histogram?
Clipping occurs when the graph is stacked hard against the left or right edge, indicating pure black or pure white areas with no detail. This usually means you have lost recoverable information in shadows, highlights, or both. -
4. How is a color histogram different from a luma histogram?
A luma histogram shows overall brightness, while a color histogram separates information into red, green, and blue channels. Color histograms help you detect issues like channel clipping or strong color casts that might not be obvious in a single luminance graph. -
5. Do I still need a histogram if my camera screen looks fine?
Yes. Camera and monitor screens can be misleading due to brightness settings and ambient light. A histogram gives you an objective exposure reference so your images look consistent across different displays and in final exports.